FNS regularly conducts research and data analysis to inform program or policy decisions and understand nutrition program outcomes. In addition, FNS seeks to make data accessible to state and local agencies, service providers, and the public by developing data visualization and analytics tools that can be used to support nutrition program delivery or report on outcomes.
The below data visualization and analytics products bring together FNS, USDA, and other federal datasets to answer questions related to food security, nutrition assistance programs, and the systems that support them. Dashboards include “about” or “information” pages to answer questions about navigation, interactive functionality, data sources, and the data transformations that have been applied.
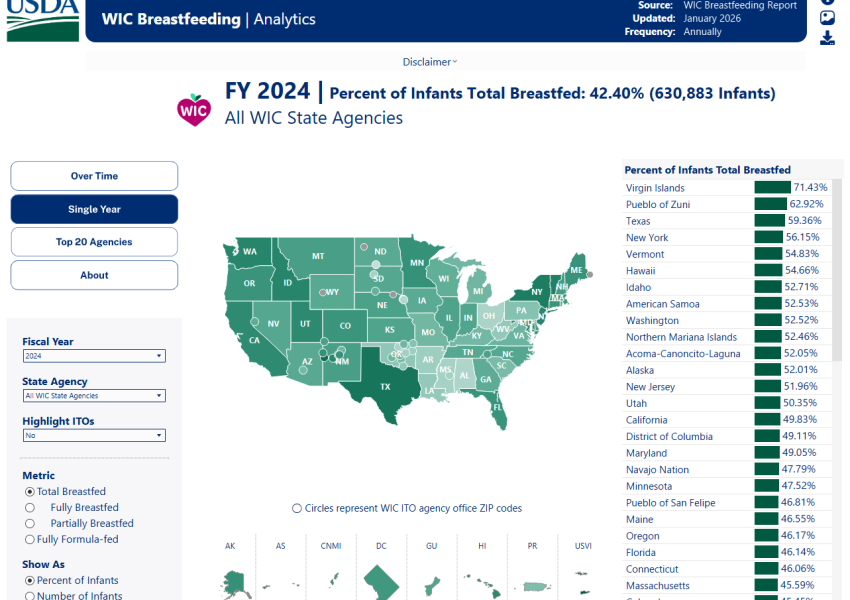
WIC Breastfeeding Data Local Agency Dashboard
The Child Nutrition Act requires USDA to annually compile and publish breastfeeding performance measurements. We use this data to monitor breastfeeding trends and to help identify exemplary performance of WIC state and local agencies in breastfeeding and make awards to such agencies.
01/15/2026
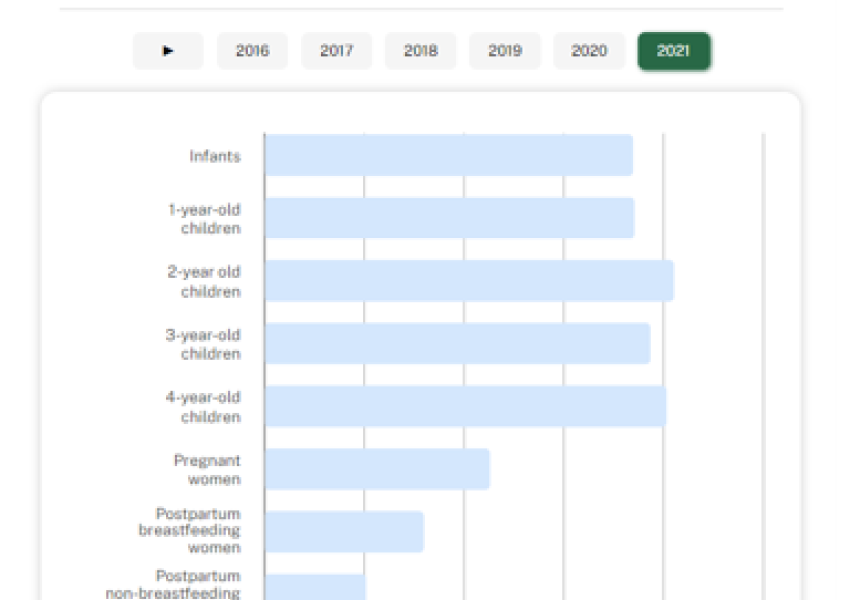
SNAP in Action Dashboard
SNAP helps put healthy food within reach for those in need. This dashboard is intended to provide the public with an understanding of how SNAP helps make nutritious food more affordable for low-income households.
06/25/2024
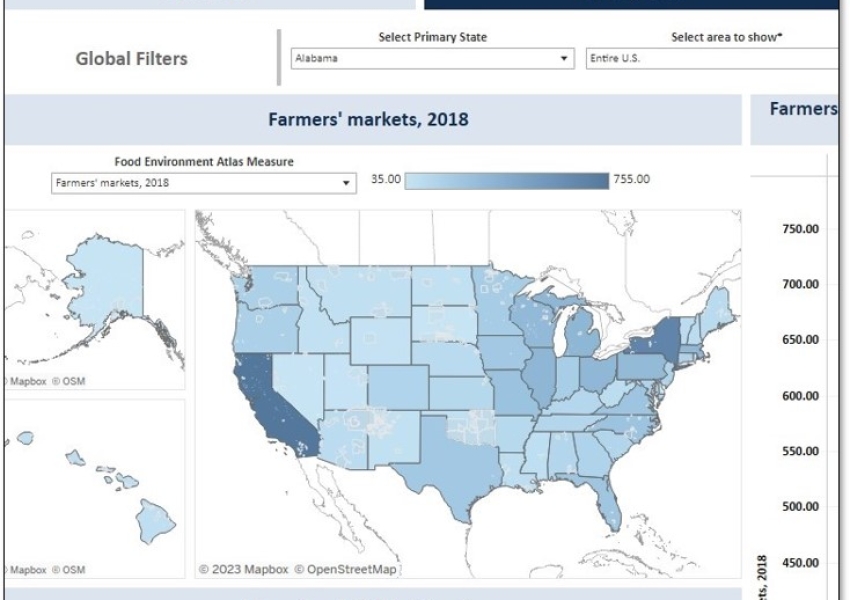
Nutrition Education and Local Food Access Dashboard
The Nutrition Education and Local Food Access Dashboard is comprised of public data. The goal of the dashboard is to provide a county-level visualization of FNS nutrition support, specifically nutrition education and local food access, alongside other metrics related to hunger and nutritional health.
06/23/2023
Estimates of WIC Eligibility and Program Reach
Each year, FNS estimates the number of eligible individuals for WIC during an average month of the calendar year. FNS uses estimates of the number of individuals eligible for WIC and the number likely to participate to better predict future funding needs, measure WIC performance, and identify potentially unmet nutrition assistance needs.
11/03/2014
Page updated: March 14, 2024