FNS regularly conducts research and data analysis to inform program or policy decisions and understand nutrition program outcomes. In addition, FNS seeks to make data accessible to state and local agencies, service providers, and the public by developing data visualization and analytics tools that can be used to support nutrition program delivery or report on outcomes.
The below data visualization and analytics products bring together FNS, USDA, and other federal datasets to answer questions related to food security, nutrition assistance programs, and the systems that support them. Dashboards include “about” or “information” pages to answer questions about navigation, interactive functionality, data sources, and the data transformations that have been applied.
SNAP in Action Dashboard
SNAP helps put healthy food within reach for those in need. This dashboard is intended to provide the public with an understanding of how SNAP helps make nutritious food more affordable for low-income households.
06/25/2024
WIC & FMNP Modernization Dashboard
WIC has been serving families for more than 50 years. To ensure that WIC continues to get results, the program must modernize.
04/04/2024
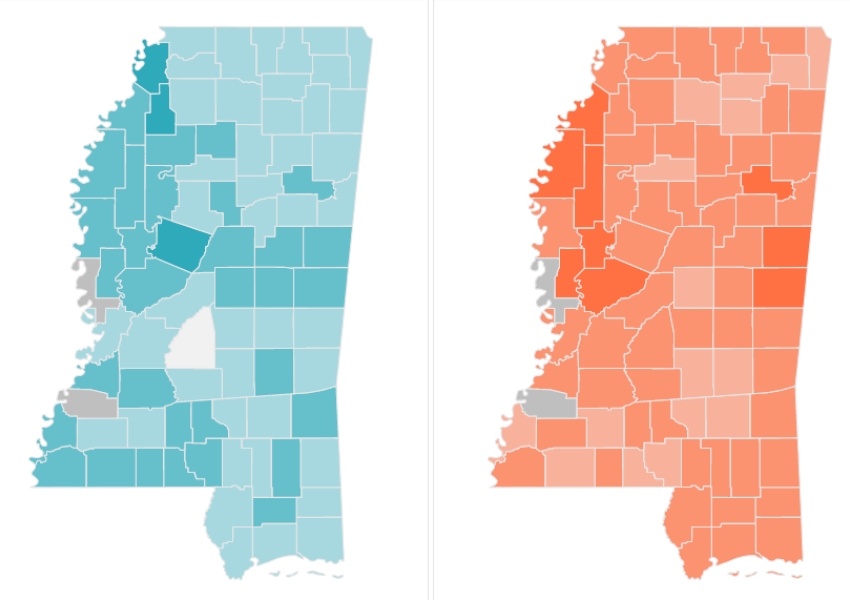
SNAP Eligibility and Access
This visualization represents a joint effort of the U.S. Census Bureau, the Food and Nutrition Service, the Economic Research Service and our state partners to use state administrative records to estimate SNAP eligibility rates at the state and county levels.
07/15/2019
Page updated: March 14, 2024