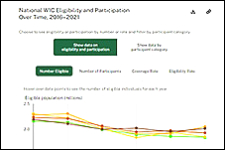
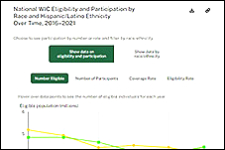
Estimates of WIC Eligibility and Program Reach
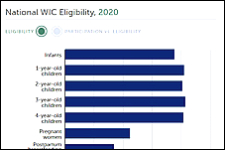
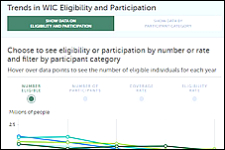
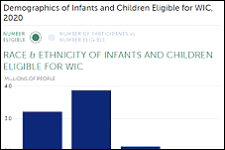
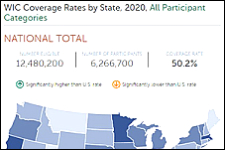
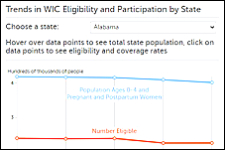
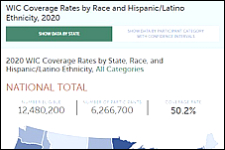
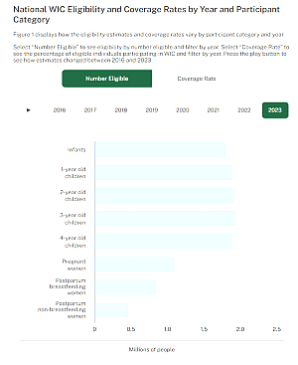
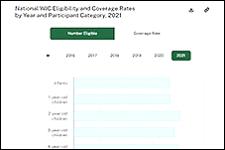
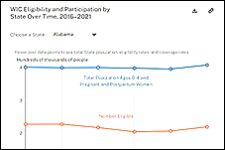
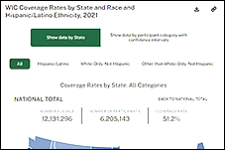
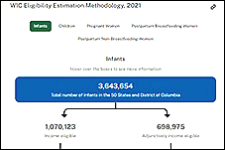
These visualizations present national and state estimates of the number of people eligible for WIC benefits and the percentage of the eligible population and the US population covered by the program, including estimates by participant category. Estimates by state and U.S. territory and by race and ethnicity are also provided.
2023
For more detailed information, including methodology, refer to the full report.
2022
For more detailed information, including methodology, refer to the full report.

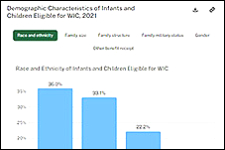
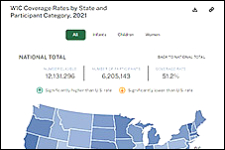
2021
For more detailed information, including methodology, refer to the full report.
2020
For more detailed information, including methodology, refer to the full report.