
Since 1988, FNS has produced biennial reports on WIC participant and program characteristics (WIC PC) for program monitoring and managing WIC information needs. The 2022 WIC PC report summarizes demographic, income, and health-related characteristics of participants with active certifications in April 2022.
The data for this report are based on WIC administrative records collected from all 89 WIC state agencies (50 states, the District of Columbia, five U.S. territories, and 33 tribal organizations). WIC PC 2022 represents information on a census of WIC participants with active certifications in April 2022, including individuals who were not issued food benefits in April. In contrast, for administrative purposes, FNS measures monthly WIC participation based on the number of certified individuals issued food benefits each month. A WIC participant might not be issued food benefits if they fail to pick up their benefits or if they leave WIC before the certification period ends.
Key Findings
- Nearly 7 million (6.8 million) women, infants, and children were certified to receive WIC benefits as of April 2022, a decline of 3.4 percent from April 2020. Of these, 6.3 million participants were issued food benefits in both April 2020 and 2022, according to administrative data.
- In 2022, 57.0 percent of WIC participants reported an income below 100 percent of the Federal Poverty Guidelines, a decline from 64.3 percent in 2020.
- In 2022, dietary and anthropometric risks were the most common broad categories of nutritional risk assigned at WIC enrollment (62.4 percent and 32.0 percent respectively). Anthropometric and hematological data were missing for most participants, as WIC clinics continued to operate under flexibilities authorized during the COVID-19 public health emergency.
- In 2022, 70.0 percent of infant WIC participants were breastfed after birth, 32.7 percent at 3 months, 22.5 percent at 6 months, and 15.4 percent at 12 months. Breastfeeding initiation and duration varied by race and ethnicity. This compares similarly to 2020.
Interactive Graphics
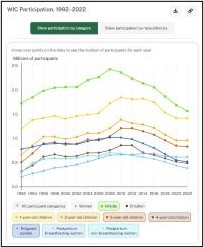
Figure 1 - WIC Participation, 1992-2022
In April 2022, 6.8 million people were certified to receive benefits from the Special Supplemental Nutrition Program for Women, Infants, and Children (WIC). Historically, the number of participants increased from 1992 through 2010 and has steadily decreased since then. Participation declined by 32 percent between 2010 and 2022.

Figure 2 - Participant Household Income as Percentage of Federal Poverty Guidelines, 2022
Most WIC participants (close to 90 percent) come from households with incomes at or below 185 percent of the Federal Poverty Guidelines issued each year by the U.S. Department of Health and Human Services. These income guidelines vary by household size and state of residency and are used to determine eligibility for certain programs, including WIC. In most areas WIC served in 2022, a household of four with an annual income of $49,025 or less was eligible for WIC.

Figure 3 - Broad Categories of Assigned Nutritional Risks, 2022
To participate in WIC, applicants must be determined to be at nutritional risk. To determine nutritional risk, a competent professional authority (CPA) conducts a nutrition assessment during the WIC certification process. During this process, CPAs determine whether applicants satisfy the requirements for at least 1 of the 130 currently allowed nutritional risk criteria for WIC eligibility.
Federal regulations require at least 1 nutritional risk criterion be documented at the time of certification; however, CPAs may document multiple risks, and state agencies may report up to 10 nutritional risk criteria per participant.
In 2022, clinical/health/medical risks were most commonly assigned for women. Dietary risks were most commonly reported for children; other risks were most commonly reported for infants. Physical presence waivers implemented by many state agencies beginning in March 2020 were still in place during April 2022. As a result, fewer anthropometric and hematological measurements were collected, which may have contributed to WIC clinic staff identifying fewer nutritional risks during certification appointments.
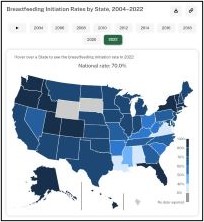
Figure 4 - Breastfeeding Initiation Rates by State, 2004-2022
Since the passage of the Child Nutrition and WIC Reauthorization Act (PL 101–147) in 1989, WIC has strengthened its breastfeeding promotion and support efforts. State and local agencies have developed a range of strategies to increase breastfeeding initiation and duration among participants. These strategies include providing current, accurate breastfeeding information through individual or group education for participants and their families; sponsoring peer-counselor programs and support groups; creating breastfeeding-friendly clinic environments and community partnerships; and providing ongoing staff education and training.
Nationally, the percentage of 6- to 13-month-old infants and children participating in WIC who initiate breastfeeding (i.e., reported as currently or ever breastfed) has generally improved over time. In 2022, breastfeeding initiation was reported for 70 percent of all 6- to 13-month-old infants and children. This percentage increased since 2004 and peaked in 2018 at 72 percent.

Figure 5 - Rates of Obesity Among 2- to 4-Year-Old Children by State, 1992-2020
Measurements for children aged 2 and older are compared with the statistical norms in the general population using the Centers for Disease Control and Prevention’s growth charts. These comparisons are used to track growth and identify participants who qualify for certain nutritional risk criteria.
The prevalence of obesity among 2- to 4-year-old children participating in WIC increased between 1992 and 2010, peaking at 16 percent in 2008 and 2010. Prevalence of obesity among 2- to 4-year-old children participating in WIC then decreased to 14 percent in 2016 before increasing again to 15 percent in 2020.