
Key Takeaway
Child care providers who participate in the USDA, Food and Nutrition Service’s Child and Adult Care Food Program (CACFP) serve healthy meals and snacks to the children in their care. Children have better overall diets on days when they are in child care than on days when they are not.
This study reviewed early child care and before and afterschool meals of CACFP, using the Healthy Eating Index-2015 (HEI-2015), to assess how well children’s diets and CACFP meals align with the Dietary Guidelines for Americans (DGA). Data for this study were collected during program year 2022-231 . These key findings focus on those most important to understanding the impact of CACFP, but all results can be found in the full report and appendices.
Definitions
- Child and Adult Care Food Program (CACFP)
The Child and Adult Care Food Program (CACFP) reimburses child and adult care providers for serving healthy meals and snacks to individuals in their care. This report focuses only on child care providers. Reimbursements help offset the cost of preparing those meals.
- Early Child Care
In this study, early child care program providers serve children from infants through age 5 years and include child care centers, Head Start centers, and family day care homes.
- Before and Afterschool
In this study, before and afterschool program providers serve children ages 6-12 years through at-risk afterschool centers and outside-school-hours care centers.
- Healthy Eating Index-2015 (HEI-2015)
This study uses the Healthy Eating Index-2015 (HEI-2015) to assess how well children’s diets and CACFP meals align with the Dietary Guidelines for Americans (DGA) (and with the 2020-2025 DGA, since no major changes were made to recommendations for individuals 2 years or older). We use the HEI to assess how nutritious a set of foods is. This study examined two sets of foods: all the foods children ate in a day and all the meals/snacks CACFP providers served in a week.
The HEI produces two types of scores: a total score and component scores. The total score ranges from 0 (the set of foods does not align with the DGA) to 100 (the set of foods fully aligns with the DGA). The total score can be broken down into component scores, which show how well the set of foods meets recommendations to eat or limit specific foods/nutrients (components). Each component has a maximum score of 5 or 10, but this study converted component scores to percentages—100% means a component had the maximum score. The two types of components are:
- Adequacy components are foods and nutrients encouraged by the DGA: total fruits, whole fruits, total vegetables, greens and beans, whole grains, dairy, total protein foods, seafood and plant proteins, and fatty acids.
- Moderation components are foods and nutrients that the DGA recommends limiting: refined grains, sodium, added sugars, and saturated fats.
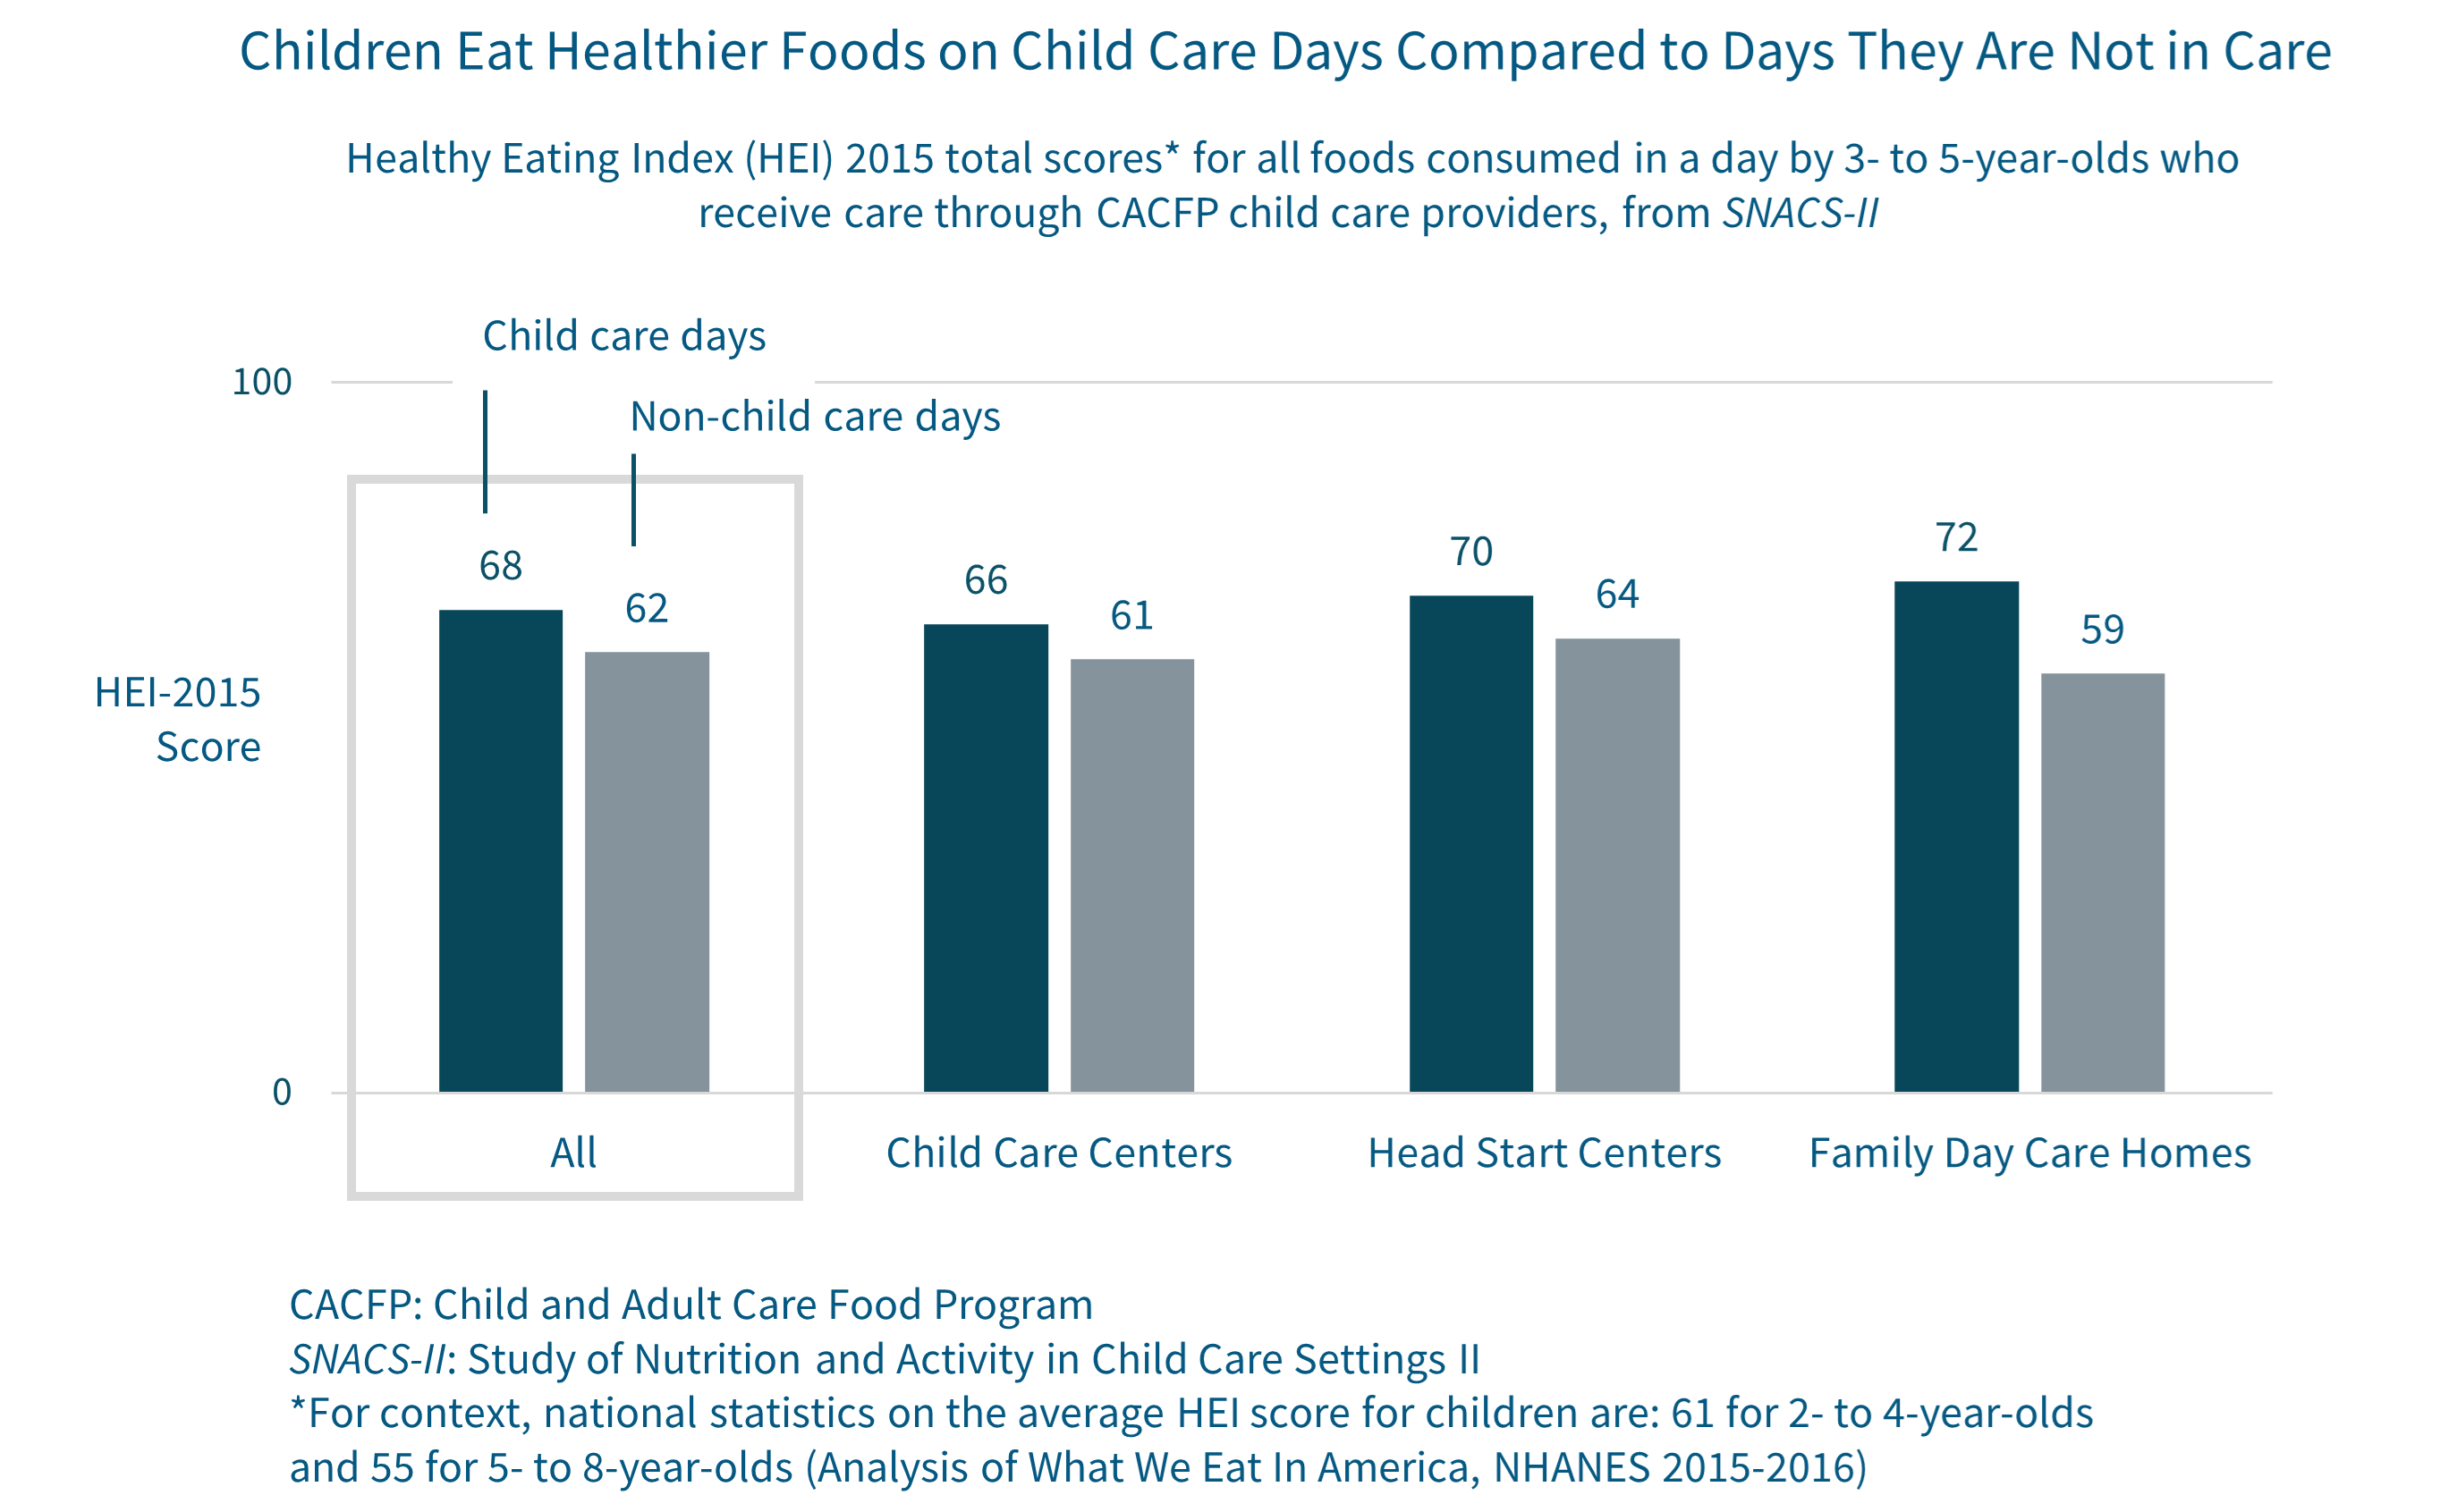
When in the care of providers participating in CACFP, children have better overall diets on days when they are in child care than on days when they are not.
With the help of parents and study staff, SNACS-II collected data on everything kids ate over the course of a day, both at child care and at home. We found that in program year 2022-23, 3- to 5-year-old children had better overall diets on days when they attended child care than on days when they did not attend. On days in child care, 3- to 5-year-olds consumed more vegetables, fruit, whole grains, and dairy compared to days not in child care. They also consumed fewer calories from saturated fats and added sugars. These differences contributed to their higher HEI total score on days when they were in child care.
The meals and snacks CACFP providers served in 2022-23 aligned with the Dietary Guidelines for Americans.
SNACS-II measured how the meals and snacks served by CACFP child care providers aligned with the DGA in three ways:
- USDA meal pattern requirements
- USDA requires CACFP providers to serve different meal patterns for breakfast, lunch, and snacks. Meal patterns are combinations of meal components (fruits, vegetables, grains, meats/meat alternates, and fluid milk) served in portions that vary by age. Our study found that CACFP meal patterns align with the DGA.
- In this study, most early child care programs served all the required meal components to 3- to 5-year-olds at breakfast (96%), lunch (82%), and snacks (85%). Nearly all early child care programs (99%) also met the requirement to limit fruit juice. About half (55%) met the requirement to serve whole grain-rich foods every day.
- In this study, most before and afterschool programs served all the required meal components at snack (85%) and supper (78%).
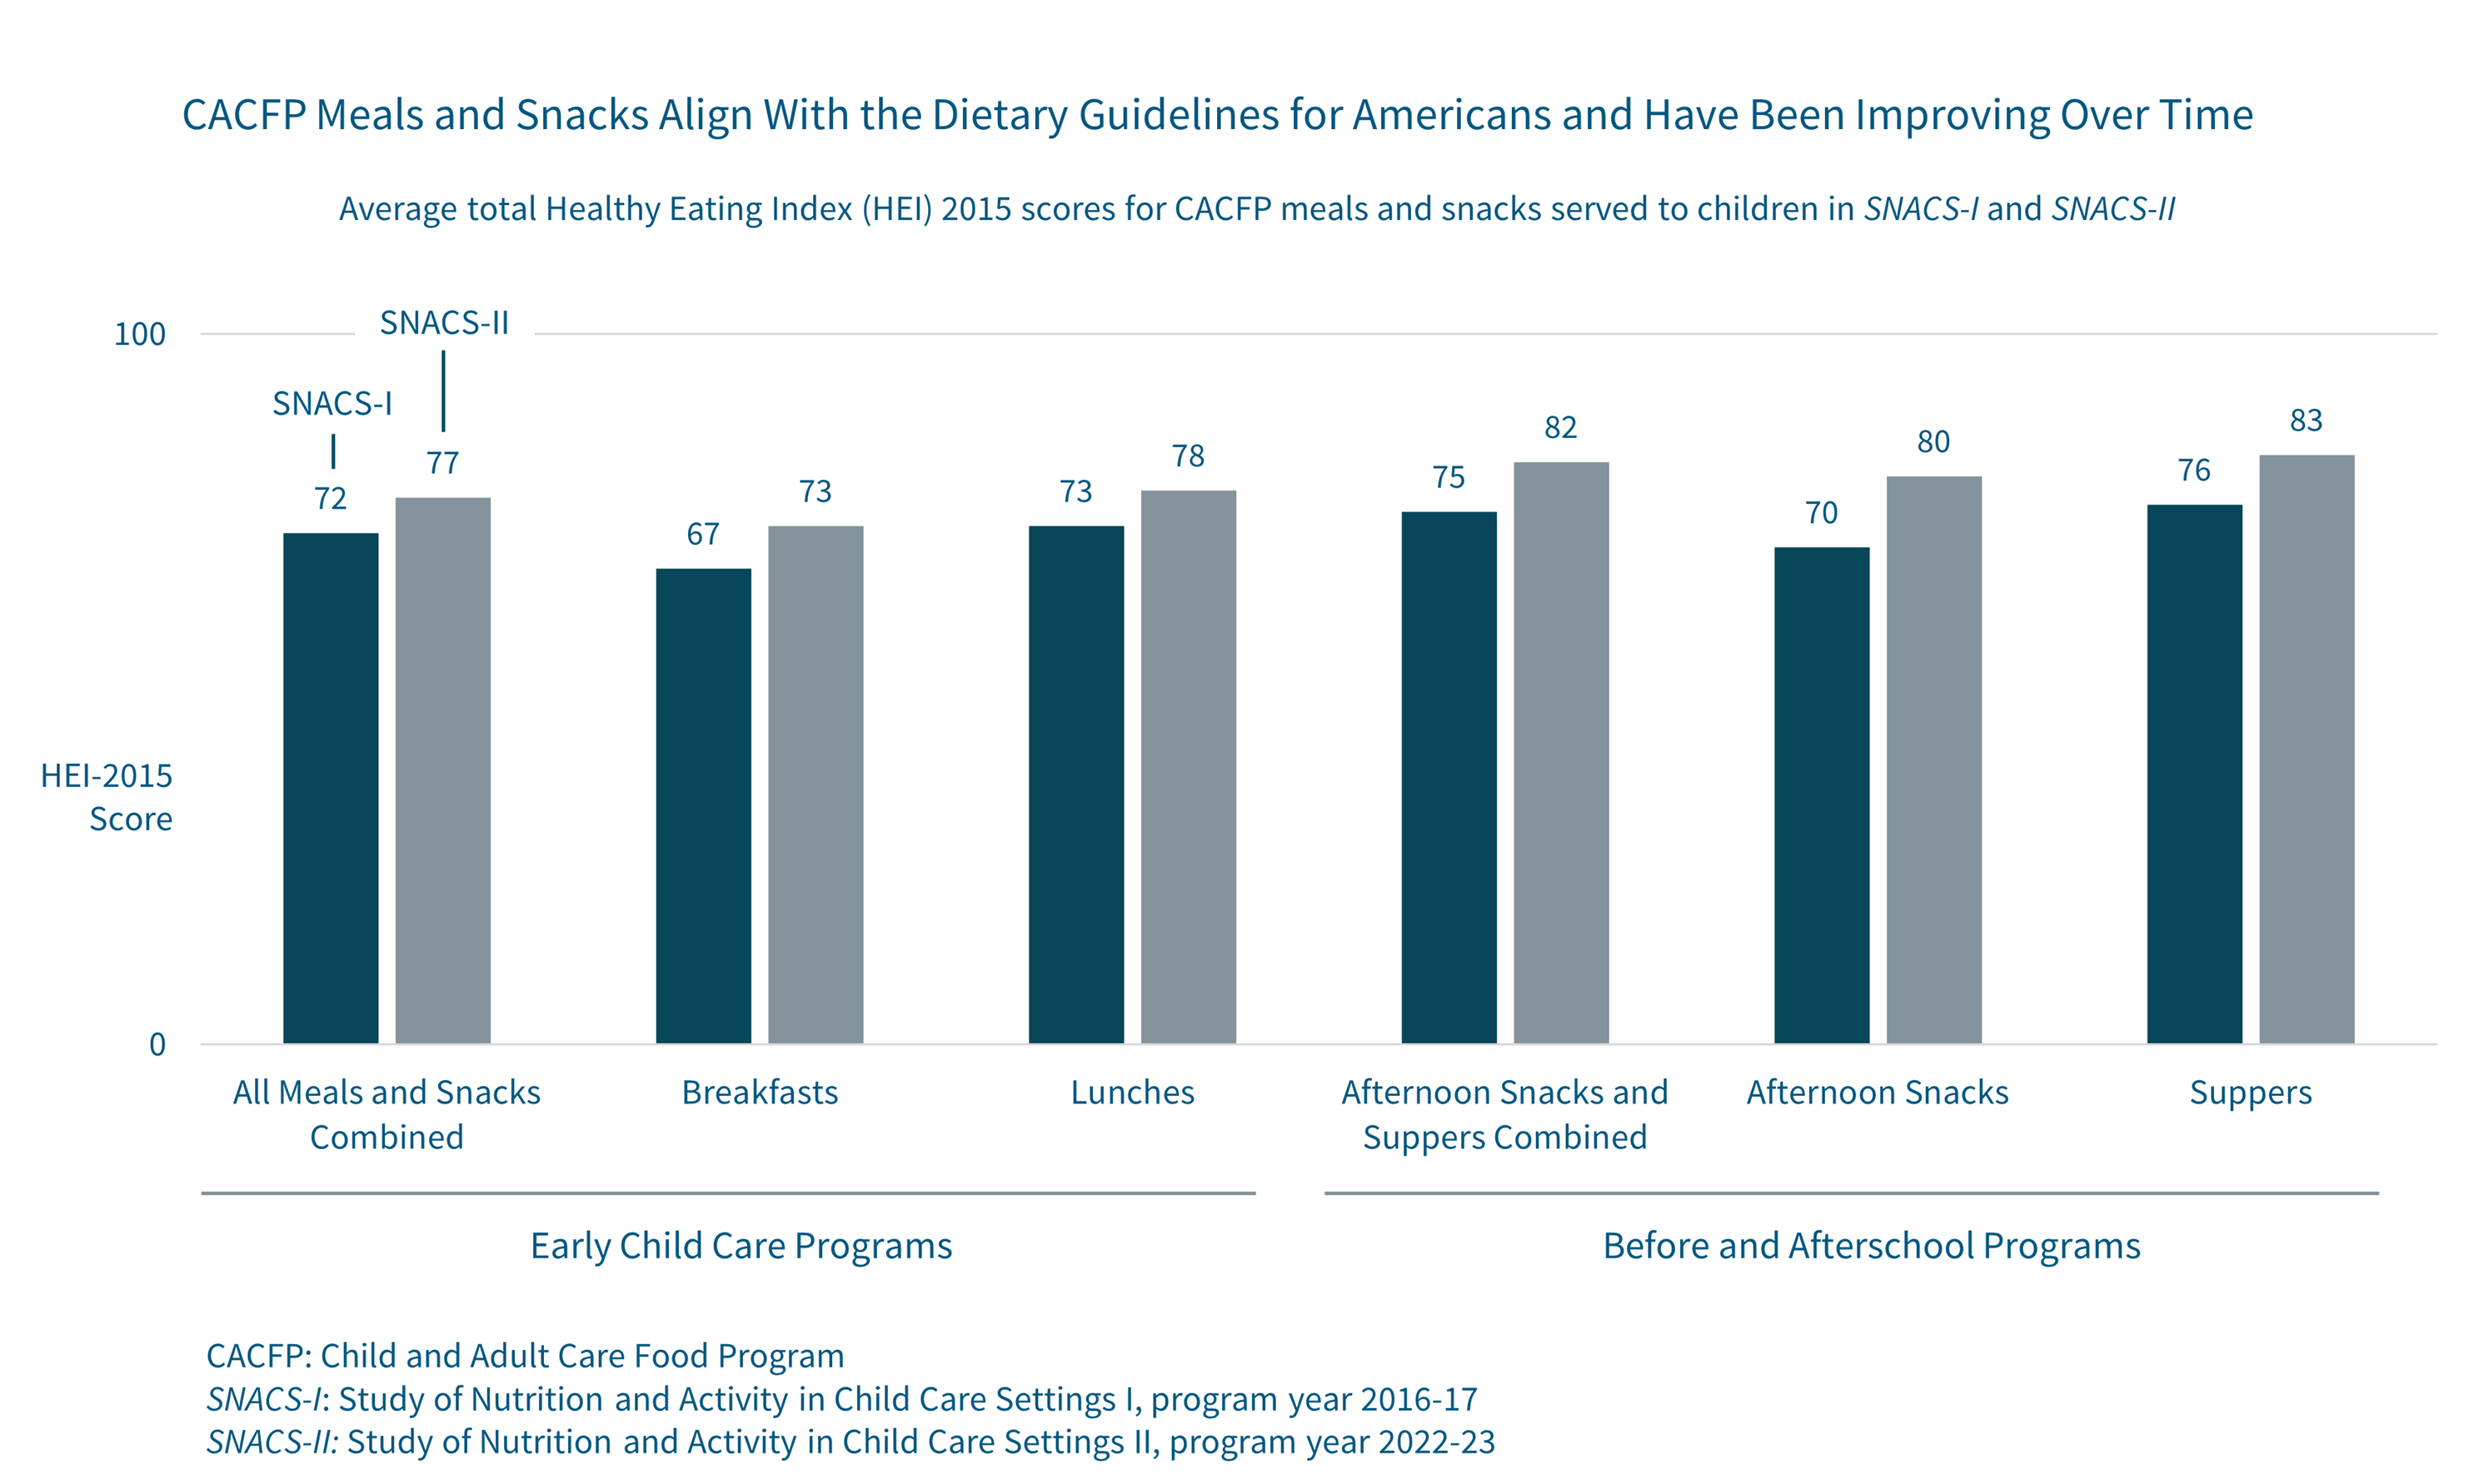
- HEI-2015 total scores over time
- HEI total scores measure how well a set of foods aligns with the DGA, with scores ranging from 0 (does not align) to 100 (aligns). People should aim to meet the dietary guidelines with their overall diet—not with every single meal—so we do not expect HEI total scores to be 100 for every single CACFP meal either. Instead, we can compare HEI total scores for CACFP meals over time to see if they are improving. We expected HEI total scores to improve from SNACS-I (collected in 2016-17) to SNACS-II (collected in 2022-23) because USDA updated the CACFP meal patterns shortly after SNACS-I to align them with the DGA.
- Note that these HEI scores for meals and snacks refer to the quality of the food served to children through CACFP, while the HEI scores in the section above refer to the food children consumed over the course of the full day.
- For children ages 3 to 5 years in early child care programs, HEI scores for breakfasts and lunches increased from SNACS-I to SNACS-II. The HEI total score for all meals and snacks combined for this age group rose from 72 in SNACS-I to 77 in SNACS-II.
- For children ages 6 to 12 years in before and afterschool programs, HEI total scores for snacks and suppers increased from 75 in SNACS-I to 82 in SNACS-II.
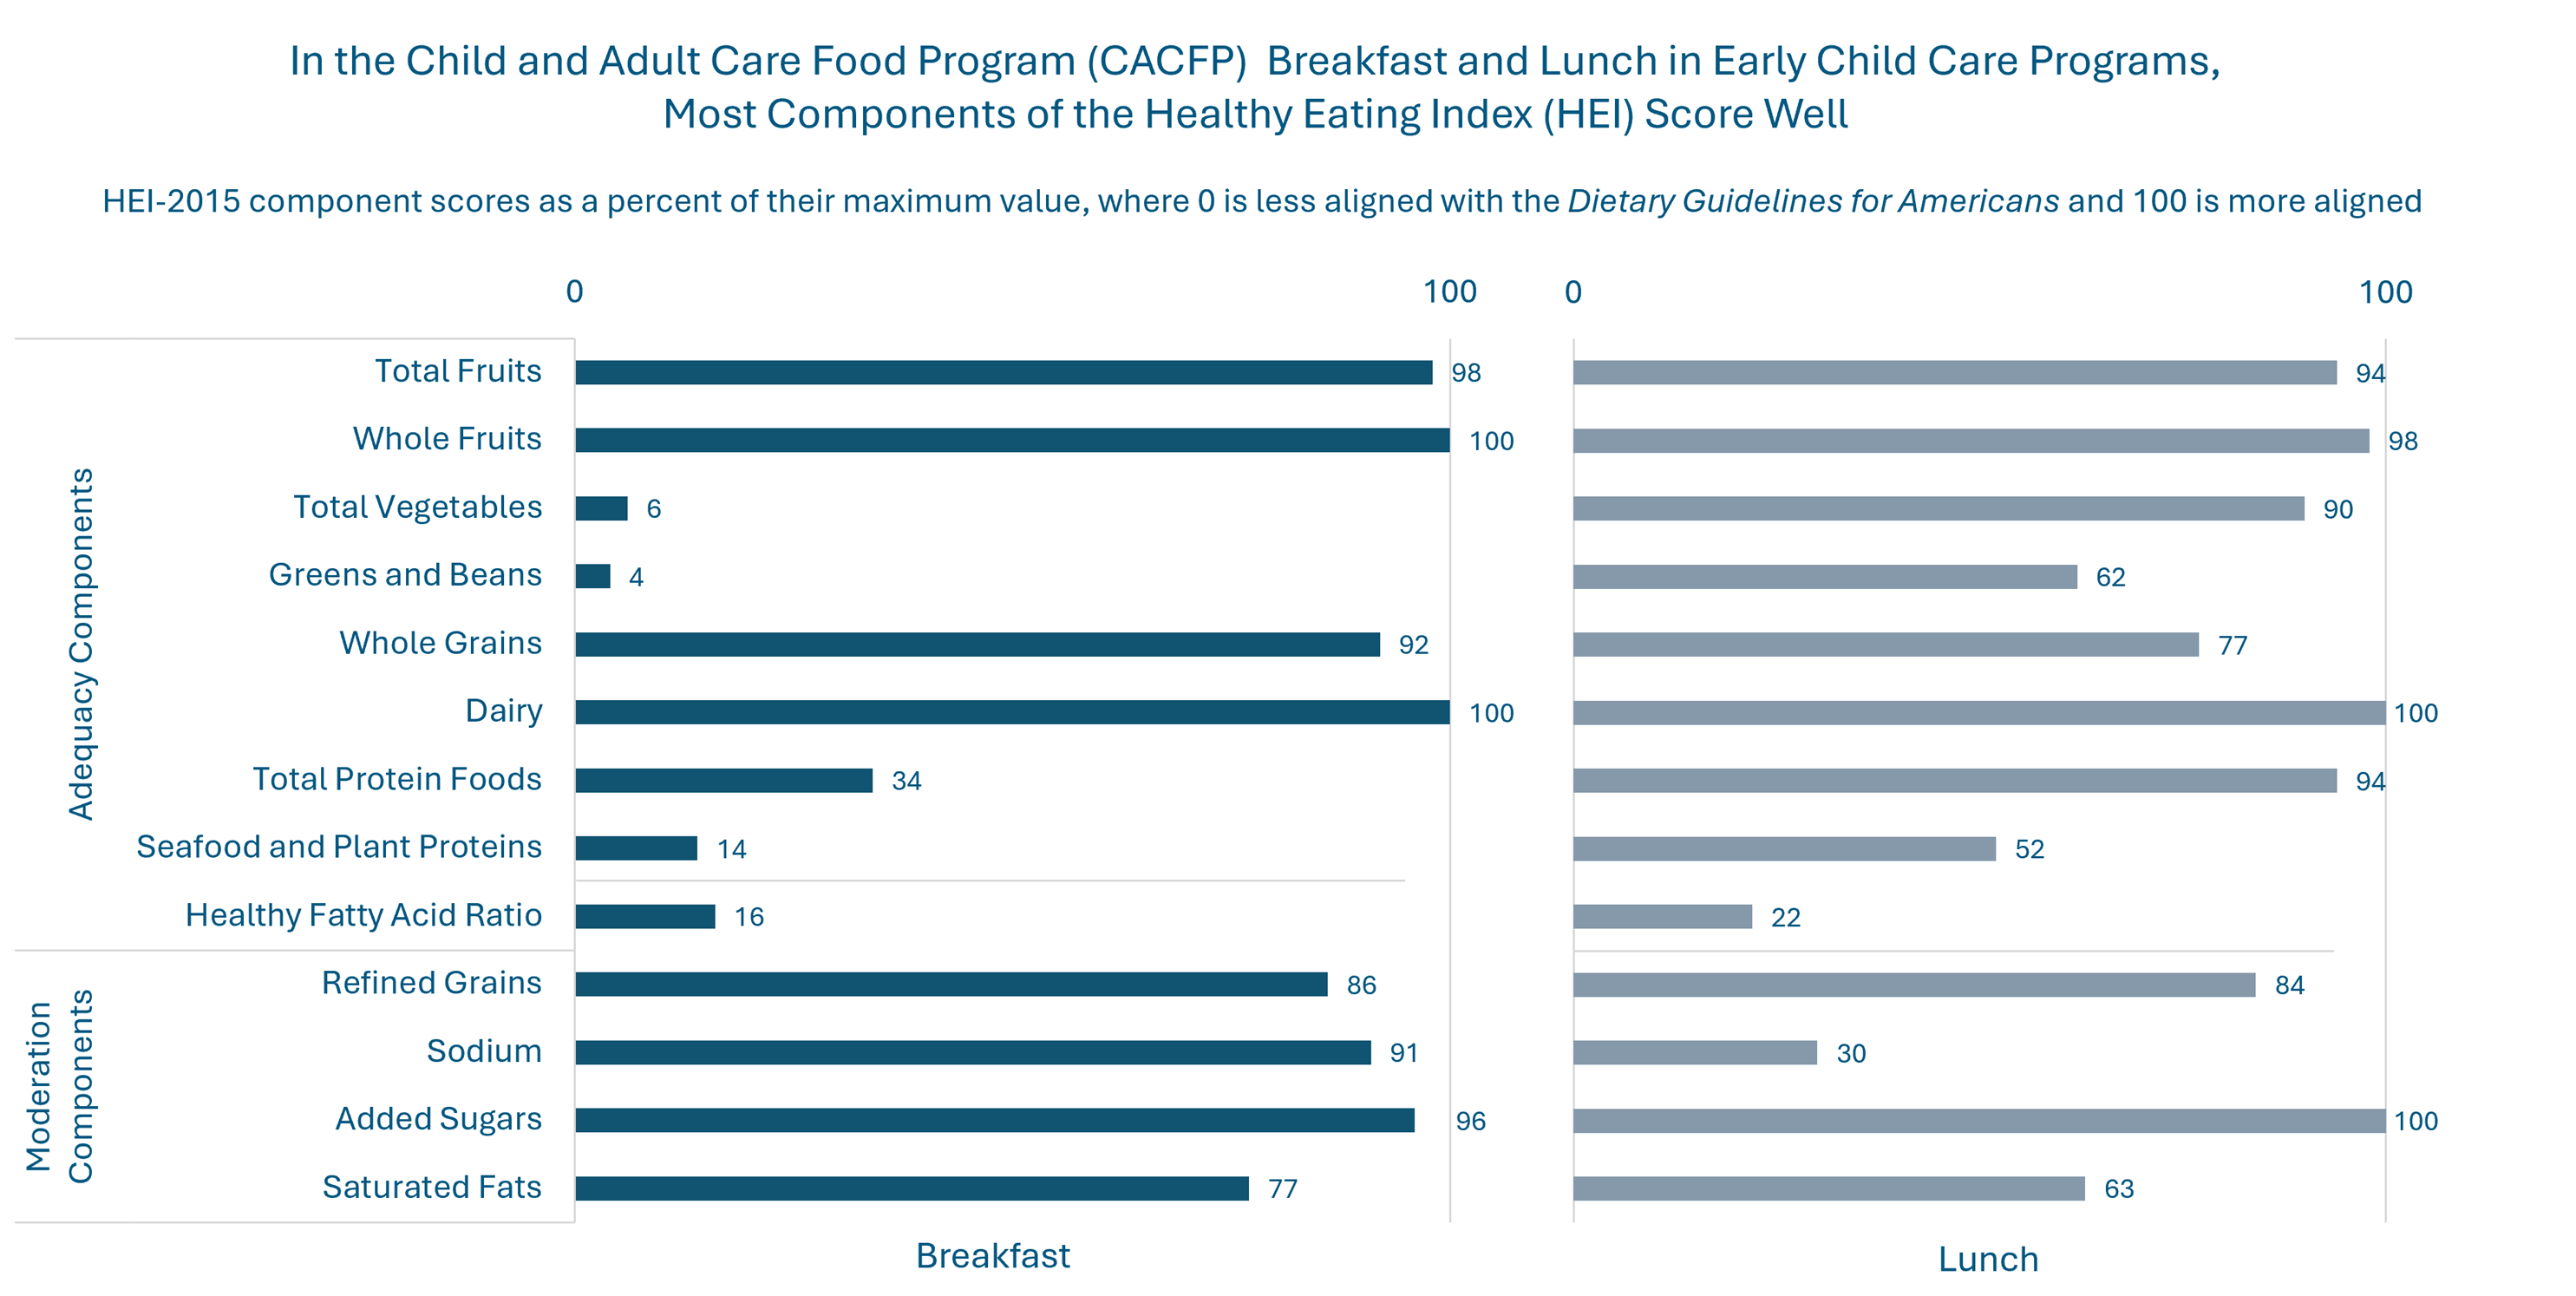
- HEI-2015 component scores
- When total HEI scores are broken down into their component parts (e.g. fruits, added sugars, etc.) for breakfast and lunch, most components scored high. Because a component may have a total of 5 or 10 points, we show component scores as a percentage of their maximum score. High component scores are good. In this study, they indicate that CACFP meals align with DGA recommendations to serve enough of some foods and nutrients (“adequacy components”) and limit others (“moderation components”). Low component scores indicate room for improvement.
- Note that the meal pattern for breakfast requires providers to serve fluid milk, a fruit or vegetable, and a grain; therefore, we expect vegetable and protein-related components to have lower scores at breakfast because they are not served as often.
- Below, we share the main findings from early child care centers in the figure and findings from before and afterschool programs in the text that follows.
- Snacks served in before and afterschool programs received high HEI component scores for total fruits (94%), saturated fats (95%), sodium (91%), and added sugars (89%), meaning snacks were consistent with DGA recommendations for those components. Scores were lower for dairy (63%) and whole grains (68%), indicating that these components are not often served as snacks since only two of five meal components are required (e.g., choice of two from fluid milk, meats/meat alternates, vegetables, fruits, and/or grains).
- Suppers served in before and afterschool programs received high HEI component scores for total fruits (98%), whole fruits (100%), dairy (100%), and added sugars (90%). The lower scores for fatty acids (42%) and sodium (50%) indicate room for improvement.
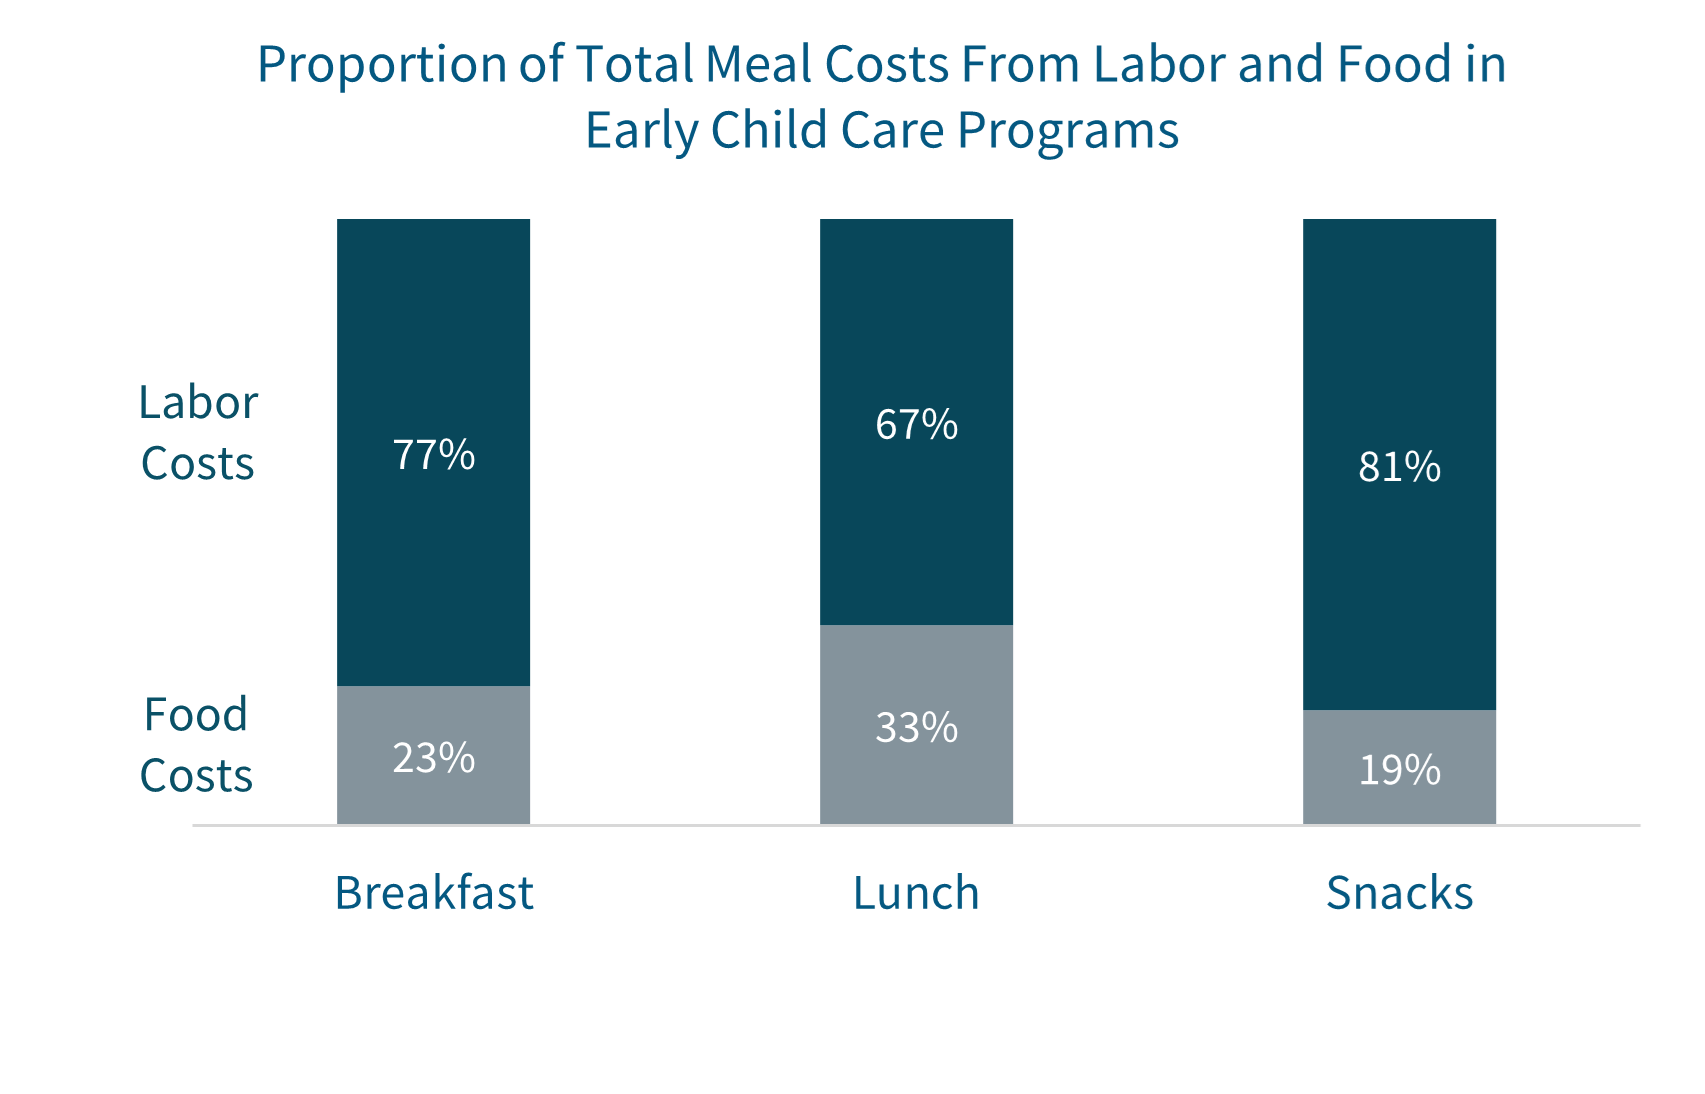
Meal reimbursement rates covered providers’ food costs but fell below total meal costs for all meal types.
USDA provides participating CACFP providers with funding (per-meal reimbursements) for meals and snacks to help offset the cost. Most of the cost to produce meals in child care centers was for labor costs rather than food costs. On average, labor costs accounted for 77% of total breakfast costs, 67% of total lunch costs, and 81% of total snack costs.
Some providers faced challenges related to CACFP.
CACFP participation: Providers reported the same top challenges to participating in CACFP in SNACS-II as they did in SNACS-I, including insufficient meal reimbursement and paperwork requirements. Although data from SNACS II indicates that CACFP reimbursements are sufficient to cover food costs, they are insufficient to cover food and labor costs. This is expected as USDA reimbursements for CACFP meals and snacks are intended to offset costs, not necessarily cover them completely.
Among SNACS-II early child care providers, 36% reported insufficient meal reimbursement as a major challenge to participation in CACFP, 31% reported it to be a minor challenge, while 33% reported it not to be a challenge. Among before and afterschool programs, 27% reported insufficient reimbursement to be a major challenge to participation, 21% reported it to be a minor challenge, while 52% reported it not to be a challenge. Paperwork requirements to receive meal reimbursement were reported as a major or minor challenge by 36% of early child care providers and 40% of before and afterschool programs, while the majority of providers reported paperwork requirements were not a challenge to participation.
Menu planning: Nearly half of providers in SNACS-II reported having no challenges planning menus that meet the CACFP meal patterns (44% of early child care programs and 48% of before and afterschool programs). Limited access to foods that fit the requirements was the most reported challenge to meeting nutritional requirements (24% of early child care programs and 27% of before and afterschool programs).
Why did FNS do this study?
SNACS-II is the second study in the SNACS study series. The series collects data about CACFP child care providers, the children they care for, the meals and snacks they serve, the cost of producing those meals and snacks, and the physical activity opportunities they provide. We use the data to learn important information about CACFP, such as how nutritious CACFP meals and snacks are and how healthy children’s diets are on the days when they are and are not in child care.
Shortly after SNACS-I data was collected for program year 2016-17, USDA updated the CACFP meal pattern requirements for the first time since 1968 (when the program began). The updated meal patterns require a larger variety of fruits and vegetables, more whole grains, and less added sugars and saturated fats. With data collected in program year 2022-23, SNACS-II helps us understand how the nutritional quality of CACFP meals and snacks and children’s diet quality may have changed with the new meal pattern requirements and provides an update on other key findings from the first study.
How did FNS do this study?
SNACS-II used similar methods to SNACS-I so we could compare key outcomes from program years 2016-17 (SNACS-I) and 2022-23 (SNACS-II).
SNACS-I and SNACS-II studied providers and children from early child care programs and before and afterschool programs. The providers and children in the SNACS studies were nationally representative, which means they had similar characteristics to all the CACFP child care providers and children in the United States. We estimated nationwide findings by scaling up the data we collected from our nationally representative study participants.
The study used surveys to collect information about the topics of interest:
- Characteristics and food service practices of CACFP providers
- Nutrient profiles of CACFP meals and snacks
- Dietary intake of children during child care and non-child care days
- Characteristics of children and families served by CACFP providers
- Infant feeding practices, infant food intake, and infants’ activity levels while in child care
- Opportunities for physical activity in programs participating in CACFP
- Plate waste
- The cost of producing a CACFP breakfast, lunch, supper, and snack
The study used the Healthy Eating Index-2015 (HEI-2015) to assess children’s diet quality and the nutritional quality of CACFP meals and snacks. The HEI total score measures how well a set of foods aligns with the Dietary Guidelines for Americans, with scores ranging from 0 (does not align) to 100 (aligns). In this study, we collected data about two sets of foods:
- All the food children ate in 24 hours: This set of foods lets us assess children’s diet quality, or how well children’s diets aligned with the DGA. We compared HEI scores on days when children did and did not attend child care to learn how CACFP meals and snacks contribute to children’s overall diet quality.
- All the food served in CACFP meals and snacks in a week: This set of foods let us assess the nutritional quality of CACFP meals and snacks as they were served, or how well the meals and snacks aligned with the DGA. We compared HEI scores in SNACS-I and SNACS-II to assess change over time.
The HEI total score is made up of 13 component scores (for more detail, see the HEI drop down box under “Definitions”). Individual components have a maximum score of five or ten but, for purposes of this study, component scores are shown as a percentage of the maximum score for that component. Therefore, a component score of 100% indicates that a diet or meal is fully aligned with DGA recommendations for that component. We used HEI component scores to assess the nutritional quality of CACFP meals and snacks.
Suggested Citation
Forrestal, S., Boyle, M., Bleiweiss-Sande, R., Franckle, R., Hu, M., Kali, J., Neelan, T., and Niland, K. (2025). Study of Nutrition and Activity in Child Care Settings II (SNACS-II). Prepared by Mathematica, AG-3198-1-9F-0151. Alexandria, VA: U.S. Department of Agriculture, Food and Nutrition Service, Office of Policy Support, Project Officer: Constance Newman. Available online at https://www.fns.usda.gov/research/cacfp/snacs2.
FNS Office of Evidence, Analysis, and Regulatory Affairs, USDA (2026). Study of Nutrition and Activity in Child Care Settings II (SNACS II) Data. USDA Food and Nutrition Service, Office of Evidence, Analysis, and Regulatory Affairs. Dataset. https://doi.org/10.15482/USDA.ADC/31902388
1 In CACFP, program years align with the federal fiscal year. For example, in this case, program year 2022-23 ran from Oct. 1, 2022 through Sept. 30, 2023.