We regularly conduct research and data analysis to inform program or policy decisions and understand nutrition program outcomes. In addition, we seek to make data accessible to state and local agencies, service providers, and the public by developing data visualization and analytics tools that can be used to support nutrition program delivery or report on outcomes.
The below data visualization and analytics products bring together FNA, USDA, and other federal datasets to answer questions related to food security, nutrition assistance programs, and the systems that support them. Dashboards include “about” or “information” pages to answer questions about navigation, interactive functionality, data sources, and the data transformations that have been applied.
Farm to School State Formula Grants Dashboard
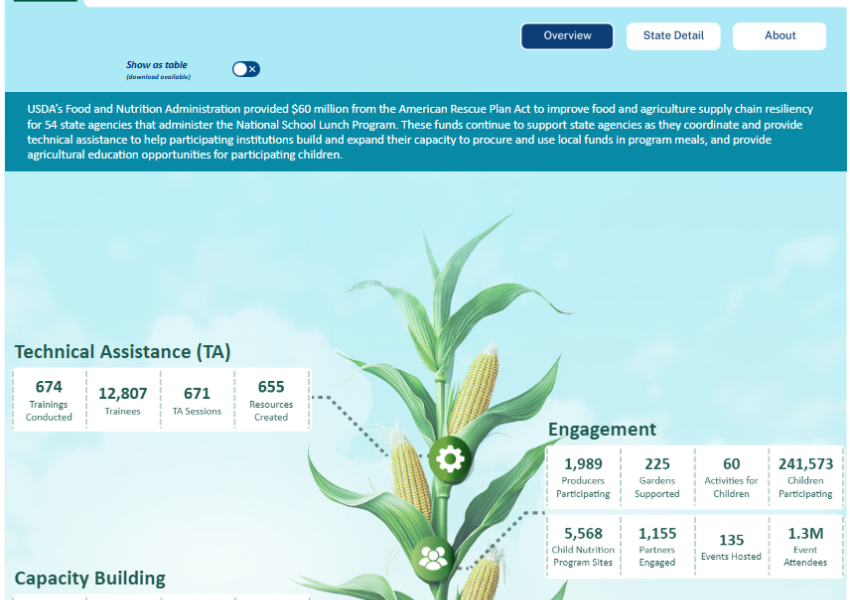
We provided $60 million from the American Rescue Plan Act to improve food and agriculture supply chain resiliency for 54 state agencies that administer the National School Lunch Program. Use this dashboard to explore successes implemented by each state and territory.
07/30/2026
Page updated: August 11, 2026