SNAP Eligibility and Access
Monday, July 15, 2019
Data type
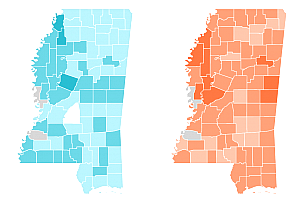
Visualization
This visualization represents a joint effort of the U.S. Census Bureau, the Food and Nutrition Service, the Economic Research Service and our state partners to use state administrative records to estimate SNAP eligibility rates at the state and county levels.