FNS regularly conducts research and data analysis to inform program or policy decisions and understand nutrition program outcomes. In addition, FNS seeks to make data accessible to state and local agencies, service providers, and the public by developing data visualization and analytics tools that can be used to support nutrition program delivery or report on outcomes.
The below data visualization and analytics products bring together FNS, USDA, and other federal datasets to answer questions related to food security, nutrition assistance programs, and the systems that support them. Dashboards include “about” or “information” pages to answer questions about navigation, interactive functionality, data sources, and the data transformations that have been applied.
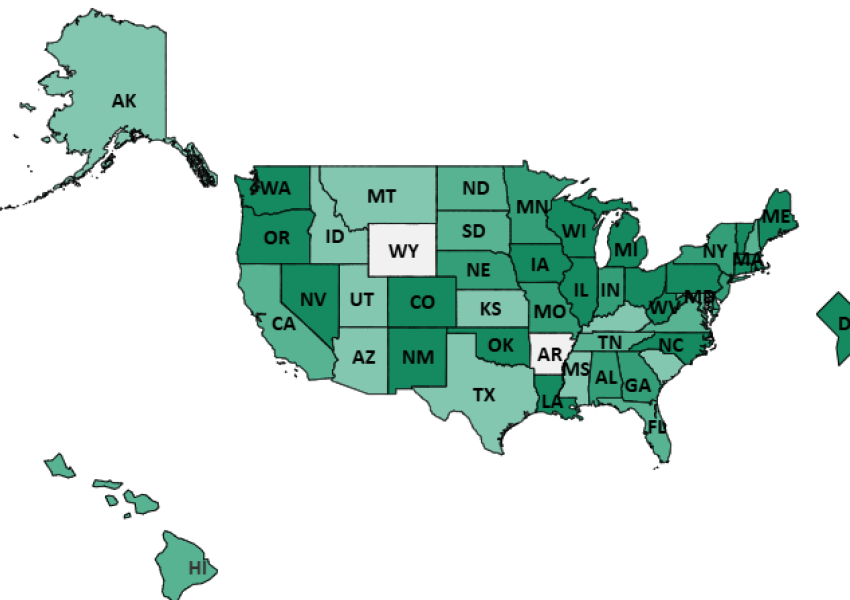
SNAP Household Characteristics Dashboard
This dashboard describes the economic and demographic characteristics of households participating in SNAP by state and over time, as well as SNAP participation rates by state and by household characteristic.
06/13/2025
WIC & FMNP Modernization Dashboard
WIC has been serving families for more than 50 years. To ensure that WIC continues to get results, the program must modernize.
04/04/2024
Child Nutrition Dashboard
The goal of the dashboard is to provide national and state level visualization of meals served, participation, and funding data for the National School Lunch Program, School Breakfast Program, Child and Adult Care Food Program, and Summer Food Service Program. The dashboard can be used by federal, state, and local organizations to assess trends in child nutrition program activity.
02/14/2024
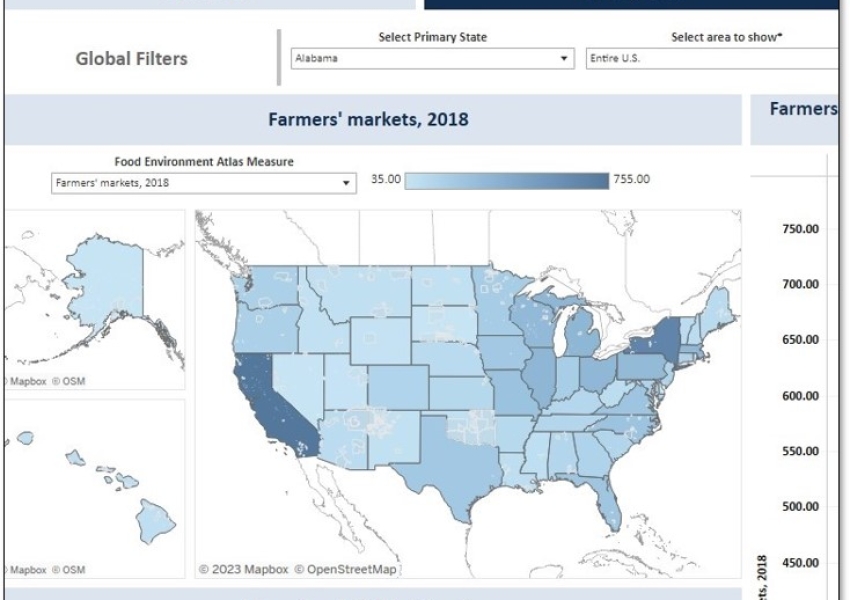
Nutrition Education and Local Food Access Dashboard
The Nutrition Education and Local Food Access Dashboard is comprised of public data. The goal of the dashboard is to provide a county-level visualization of FNS nutrition support, specifically nutrition education and local food access, alongside other metrics related to hunger and nutritional health.
06/23/2023
Page updated: March 14, 2024