FNS regularly conducts research and data analysis to inform program or policy decisions and understand nutrition program outcomes. In addition, FNS seeks to make data accessible to state and local agencies, service providers, and the public by developing data visualization and analytics tools that can be used to support nutrition program delivery or report on outcomes.
The below data visualization and analytics products bring together FNS, USDA, and other federal datasets to answer questions related to food security, nutrition assistance programs, and the systems that support them. Dashboards include “about” or “information” pages to answer questions about navigation, interactive functionality, data sources, and the data transformations that have been applied.
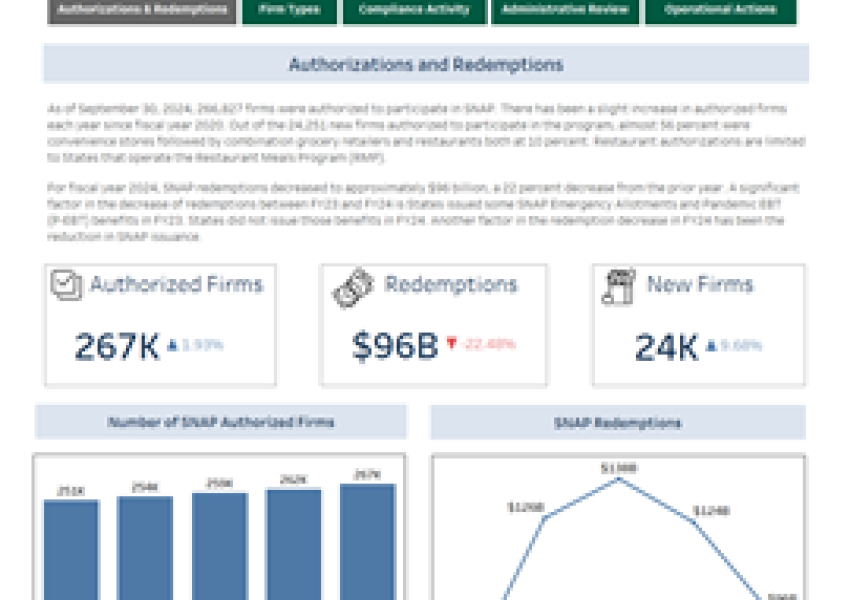
SNAP Household Characteristics Dashboard
This dashboard describes the economic and demographic characteristics of households participating in SNAP by state and over time, as well as SNAP participation rates by state and by household characteristic.
06/13/2025
Page updated: March 14, 2024